
Keeping track of public sector spending is crucial for government accountability and economic planning. The UK government releases detailed data on its expenditures, but making sense of this information can be challenging. Fortunately, there are several tools available to help analyse and understand these spending trends.
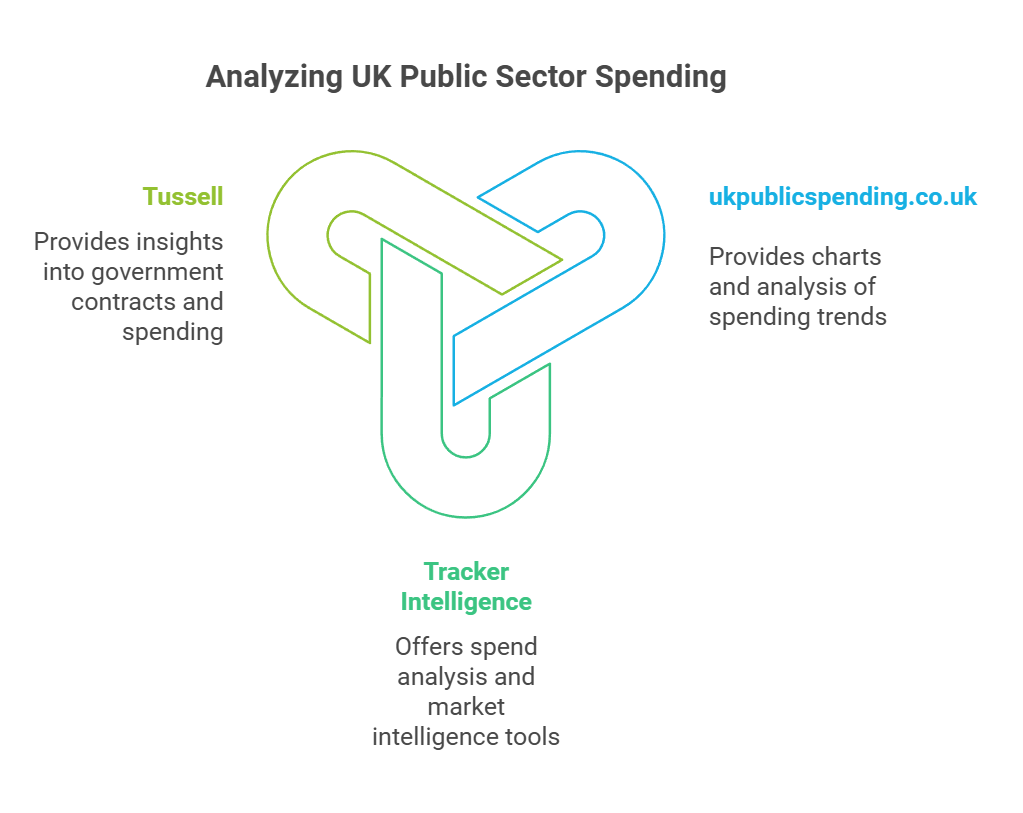
The most useful tools for analysing UK public sector spending include ukpublicspending.co.uk, Tracker Intelligence, and Tussell. These platforms offer different features to help users dive into the data. For example, ukpublicspending.co.uk provides charts and analysis of UK government spending trends, while Tracker Intelligence offers spend analysis and market intelligence tools.
Understanding public sector spending trends is vital for businesses, researchers, and citizens alike. These tools can reveal important insights about government priorities, economic conditions, and potential opportunities for engagement with the public sector.
Key Takeaways
- Tools like ukpublicspending.co.uk and Tussell provide detailed analysis of UK public spending
- Public sector IT spending has seen significant growth in recent years
- Regular updates to spending data help track changes in government priorities and economic conditions
Understanding UK Public Sector Spending
The UK government allocates funds for various public services and programmes. This spending impacts the economy and citizens' daily lives. Public expenditure covers areas like healthcare, education, and infrastructure.
Defining Public Sector Expenditure
Public sector expenditure refers to money spent by the government and its agencies. It includes current expenditure and net investment. Current expenditure covers day-to-day costs like wages and supplies. Net investment involves long-term projects such as building roads or hospitals.
The government divides spending into different categories:
- Departmental spending (e.g. NHS, education)
- Welfare payments
- Debt interest payments
- Capital investment
This classification helps track where money goes and measure its effectiveness.
Overview of Total Public Spending
Total public spending in the UK is expected to reach £1,276.2 billion in 2024-25. This equates to about £45,000 per household. As a percentage of national income, it's projected to be 45.3%.
Public spending fluctuates based on economic conditions and government policies. In recent years, it has increased due to factors like:
- COVID-19 pandemic response
- Ageing population (higher healthcare costs)
- Infrastructure investments
The government aims to balance spending with revenue to manage the budget deficit.
The Role of Central and Local Government
Central government handles most public spending in the UK. It funds major services like:
- NHS
- Defence
- State pensions
Local governments play a crucial role too. They manage services such as:
- Social care
- Waste collection
- Local transport
Central government provides funding to local authorities through grants. Local councils also raise money through council tax and business rates. This system aims to balance national priorities with local needs.
Public Sector Net Debt and National Debt
Public sector net debt is the total amount the UK government owes. It's the result of borrowing to cover budget deficits over time. National debt is similar but includes additional financial liabilities.
Key points about UK public debt:
- It's expressed as a percentage of GDP
- It's increased significantly since the 2008 financial crisis
- High debt levels can limit future spending options
The government aims to reduce debt over time. This involves balancing spending with revenue and promoting economic growth. However, unexpected events like the COVID-19 pandemic can lead to rapid debt increases.
Economic Context and Impact
Public sector spending in the UK is closely tied to the nation's economic health. Economic conditions shape government budgets and spending priorities, while public expenditure in turn influences economic growth and stability.
Relation to Gross Domestic Product (GDP)
The UK government uses public spending as a percentage of GDP to measure the public sector's size relative to the whole economy. In 2022-23, total managed expenditure reached 45.3% of GDP, a 1.0 percentage point increase from the previous year.
This ratio helps policymakers and analysts:
• Compare spending levels over time
• Assess fiscal sustainability
• Benchmark against other countries
A rising percentage may indicate expanded public services or economic challenges, while a falling ratio might suggest fiscal tightening or robust economic growth.
Consequences of Economic Downturn
During economic downturns, public spending often increases as a share of GDP. This occurs due to:
- Automatic stabilisers: Higher unemployment benefits and lower tax revenues
- Discretionary fiscal measures: Government stimulus programmes
These factors can lead to budget deficits and rising public debt. The Institute for Fiscal Studies notes that economic shocks can quickly alter fiscal forecasts, potentially derailing plans for budget surpluses.
Impact of Economic Growth on Public Spending
Economic growth typically boosts public finances through:
• Increased tax revenues
• Reduced welfare spending
• Greater fiscal flexibility
Strong growth can allow governments to expand public services or reduce deficits without raising taxes. However, the nature of public spending affects its economic impact. Capital investments may stimulate long-term growth, while transfer payments have different economic effects.
Policymakers must balance short-term needs with long-term fiscal sustainability when making spending decisions in various economic conditions.
Budgeting and Fiscal Management
The UK government uses various tools and frameworks to manage public spending. These include setting fiscal targets, dividing expenditure into different categories, and relying on independent forecasts.
Budget Deficit and Fiscal Targets
The UK aims to keep its budget deficit under control. This deficit occurs when the government spends more than it earns from taxes and other revenue sources. To manage this, the government sets fiscal targets.
These targets help guide spending decisions and maintain financial stability. The government often adjusts these targets based on economic conditions and policy priorities.
Tracking the deficit over time allows policymakers to assess fiscal health. It also helps them make informed decisions about future spending and tax policies.
Resource Departmental AME and DEL Framework
The UK uses a specific framework to categorise public spending. This system divides expenditure into two main types: Annually Managed Expenditure (AME) and Departmental Expenditure Limits (DEL).
AME covers spending that is hard to predict or control, such as welfare benefits. DEL, on the other hand, includes spending that departments can plan for in advance.
DEL is further split into Resource DEL and Capital DEL. Resource DEL covers day-to-day spending, while Capital DEL is for investment in assets like infrastructure.
This framework helps the government plan and control spending more effectively. It allows for better budget allocation and fiscal management.
Role of the Office for Budget Responsibility
The Office for Budget Responsibility (OBR) plays a crucial role in UK fiscal management. It provides independent economic and fiscal forecasts.
The OBR assesses the government's performance against its fiscal targets. It also examines the long-term sustainability of public finances.
These forecasts and assessments help inform government policy decisions. They also provide transparency and credibility to the budgeting process.
The OBR's work is essential for setting spending reviews and determining overall spending envelopes for future years.
Statistical Sources and Reporting
The UK government provides several key sources of data and reports on public sector spending. These tools offer detailed insights into expenditure trends across different departments and functions.
The Importance of National Statistics
National statistics play a vital role in understanding public sector spending. They provide reliable, impartial data that helps policymakers, researchers, and the public make informed decisions.
The UK Statistics Authority oversees the production of official statistics. They ensure the data meets high standards of quality and integrity.
National statistics on public spending cover areas like:
- Total government expenditure
- Spending by department
- Regional breakdowns
- Long-term trends
These figures are crucial for analysing the effectiveness of government policies and programmes.
HM Treasury and Spending Reports
HM Treasury is a key source of public spending data. They release regular reports that offer deep insights into UK government expenditure.
Some important HM Treasury publications include:
- Monthly public sector finances statistics
- Budget reports
- Spending reviews
These reports provide detailed breakdowns of spending across different government departments and functions. They often include both historical data and future projections.
HM Treasury's data is particularly useful for tracking long-term spending trends. Their reports typically cover periods of several years or even decades.
Office for National Statistics Data
The Office for National Statistics (ONS) is another crucial source of public spending data. They produce a wide range of statistics on government expenditure and the wider economy.
Key ONS publications related to public spending include:
- Public sector finances
- GDP estimates
- Regional economic activity reports
The ONS has been working to provide more localised data on public sector spending. This helps in understanding how government money is spent in different parts of the UK.
ONS data is known for its reliability and comprehensiveness. It's widely used by researchers, policymakers, and journalists.
Public Expenditure Statistical Analysis
Public Expenditure Statistical Analysis (PESA) is a key annual publication by HM Treasury. It provides a detailed overview of UK public spending.
PESA includes:
- Historical spending data
- Future spending plans
- Breakdowns by function and department
- Regional analyses
The report uses data from various government departments and agencies. It offers a comprehensive picture of how public money is spent.
PESA is particularly useful for analysing long-term trends. It typically includes data going back several decades, allowing for in-depth historical comparisons.
Key Areas of Public Expenditure
The UK government allocates funds to several crucial sectors. These areas shape the nation's social and economic landscape, reflecting policy priorities and public needs.
Health and Social Care Funding
The National Health Service (NHS) receives a significant portion of public spending. This covers hospital services, primary care, and mental health support.
Social care funding addresses the needs of elderly and disabled individuals. It includes home care services and residential facilities.
Recent years have seen increased investment in preventive healthcare programmes. These aim to reduce long-term costs and improve public health outcomes.
Mental health services have gained more attention, with targeted funding to expand access and improve treatment options.
Defence Spending Analysis
The UK maintains a robust defence budget to ensure national security. This covers:
- Personnel costs (salaries, training)
- Equipment procurement
- Research and development
- Military operations and maintenance
Defence expenditure trends show a focus on modernising forces and adapting to new threats.
Cybersecurity has become a key area of investment, reflecting the changing nature of warfare and national defence.
Education and Welfare
Education spending encompasses primary, secondary, and higher education sectors. Key areas include:
- Teacher salaries and training
- School infrastructure
- Curriculum development
- Special education needs support
Welfare spending addresses social security benefits, including:
- Unemployment support
- Housing benefits
- Child benefits
- Disability allowances
Recent reforms have aimed to streamline welfare systems and promote employment opportunities.
Education budgets have focused on reducing inequalities and improving skills for the job market.
Public Services and Infrastructure
Public sector expenditure on services covers a wide range of areas vital to daily life.
Transport infrastructure receives significant investment, including:
- Road maintenance and expansion
- Rail network improvements
- Public transport subsidies
Housing and community amenities funding addresses:
- Social housing projects
- Urban regeneration initiatives
- Green spaces and community facilities
Public order and safety expenditure covers police forces, fire services, and the justice system.
Environmental protection has gained importance, with increased spending on:
- Renewable energy projects
- Flood defence systems
- Air quality improvement measures
Current Trends and Changes
UK public sector spending has seen significant shifts in recent years. Several key factors have driven changes in expenditure patterns and fiscal priorities.
Effects of the COVID-19 Pandemic
The COVID-19 pandemic caused major disruptions to public spending. The government introduced emergency measures to support the economy and healthcare system.
These included the furlough scheme, business loans, and increased NHS funding. As a result, public spending rose sharply in 2020 and 2021.
The pandemic's long-term effects continue to shape spending priorities. Healthcare and economic recovery remain key focus areas for public expenditure.
Many COVID-related programmes have now ended. However, their impact on overall spending levels and budget allocations persists.
Trends in Debt Interest and Borrowing
Rising inflation and interest rates have led to increased costs for servicing government debt. This trend is putting pressure on public finances.
The UK's debt-to-GDP ratio has grown significantly since 2020. Higher borrowing during the pandemic contributed to this increase.
Debt interest payments now consume a larger portion of the budget. This limits funds available for other public services.
The government faces challenges in managing debt levels whilst maintaining public spending commitments.
Adjustments in Response to Inflation
High inflation has impacted public sector spending in various ways. It has increased the cost of delivering public services and infrastructure projects.
The government has had to adjust spending plans to account for rising prices. This includes revising budgets for major programmes and contracts.
Wage pressures in the public sector have also grown due to inflation. This has led to difficult negotiations and potential increases in personnel costs.
Balancing inflation-driven spending increases with fiscal constraints remains a key challenge for policymakers.
Shifts in Departmental Budgets
Recent years have seen notable changes in how funds are allocated across government departments. Some areas have seen budget increases, while others face cuts.
Health and social care continue to receive a large share of public spending. The NHS budget has grown to address pandemic-related pressures and long-standing challenges.
Education and defence have also seen budget increases. In contrast, areas like local government have faced ongoing financial constraints.
These shifts reflect changing political priorities and economic realities. They have significant implications for public service delivery across the UK.
Conclusion
The UK government offers several useful tools for analysing public spending trends. These enable researchers, policymakers and citizens to gain insights into how taxpayer money is allocated and used.
Key resources include the Public Expenditure Statistical Analyses (PESA) published annually by HM Treasury. This provides detailed breakdowns of spending across departments and policy areas.
The Office for National Statistics also releases regular data on public sector finances. Their reports cover revenue, expenditure and borrowing figures.
For those seeking historical context, the Institute for Fiscal Studies offers in-depth surveys of public spending trends over time. Their analysis examines long-term patterns in different spending categories.
When using these tools, it's important to consider factors like inflation and population growth. This allows for more meaningful comparisons across different time periods.
Ultimately, these resources empower users to track how public funds are spent. They promote transparency and enable evidence-based discussions about government priorities and fiscal policies.
Frequently Asked Questions
UK public sector spending involves complex budgets, allocations, and categories. The government tracks expenditures across various departments and areas to manage the nation's finances effectively.
How is UK public sector spending projected to change in upcoming years?
The UK government expects public spending to increase in coming years. This growth is partly due to rising costs in healthcare and social services.
Inflation and population changes also impact future spending projections. The government adjusts budgets yearly to address these factors.
What are the primary categories of government expenditure in the United Kingdom?
The main categories of UK government spending include health, education, and social protection. Transport and defence are also significant areas of expenditure.
Other key spending areas are public order and safety, housing, and environmental protection. Each category receives a portion of the total budget based on national priorities.
Can you break down the differences between Resource Departmental Expenditure Limits (RDEL) and Capital Departmental Expenditure Limits (CDEL)?
RDEL covers day-to-day operational costs of government departments. This includes staff salaries, supplies, and running expenses.
CDEL focuses on long-term investments in infrastructure and assets. It funds projects like building hospitals, schools, and roads.
In terms of government spending, what distinguishes Annually Managed Expenditure (AME) from Departmental Expenditure Limits (DEL)?
AME includes spending that is harder to predict and control annually. This often covers areas like welfare benefits and debt interest payments.
DEL comprises planned budgets for government departments. These are set in advance and cover most public services and programmes.
What are the most significant components of UK public spending as depicted in the latest government pie chart?
The largest slice of the UK spending pie typically goes to social protection. This includes pensions and welfare benefits.
Health is usually the second-largest component, followed by education. Defence and transport also feature prominently in the spending breakdown.
How has the budget allocation across different public sectors evolved in the UK over recent years?
Health spending has seen significant increases in recent years. This reflects growing healthcare demands and NHS pressures.
Education budgets have also risen, though at a slower rate. Defence spending has remained relatively stable as a percentage of total expenditure.