Advocacy campaigns can gain significant power by using reliable statistics. The Office for National Statistics (ONS) provides a wealth of data that can strengthen these efforts. By leveraging ONS statistics, advocacy groups can build compelling cases, influence policy decisions, and drive positive change in society.
ONS data covers a wide range of topics, from population demographics to economic indicators. This information can help advocates identify trends, support their arguments, and measure the impact of their work. For example, health advocacy groups might use ONS health statistics to highlight areas needing improvement in the NHS.
Using ONS data in advocacy requires careful analysis and clear communication. Advocates must understand how to interpret the statistics and present them in ways that resonate with their target audiences. This approach can lead to more effective campaigns and better outcomes for the causes they champion.
Key Takeaways
- ONS statistics provide a solid foundation for evidence-based advocacy campaigns
- Effective use of data can influence policy decisions and drive social change
- Clear communication of statistics is crucial for engaging stakeholders and measuring impact
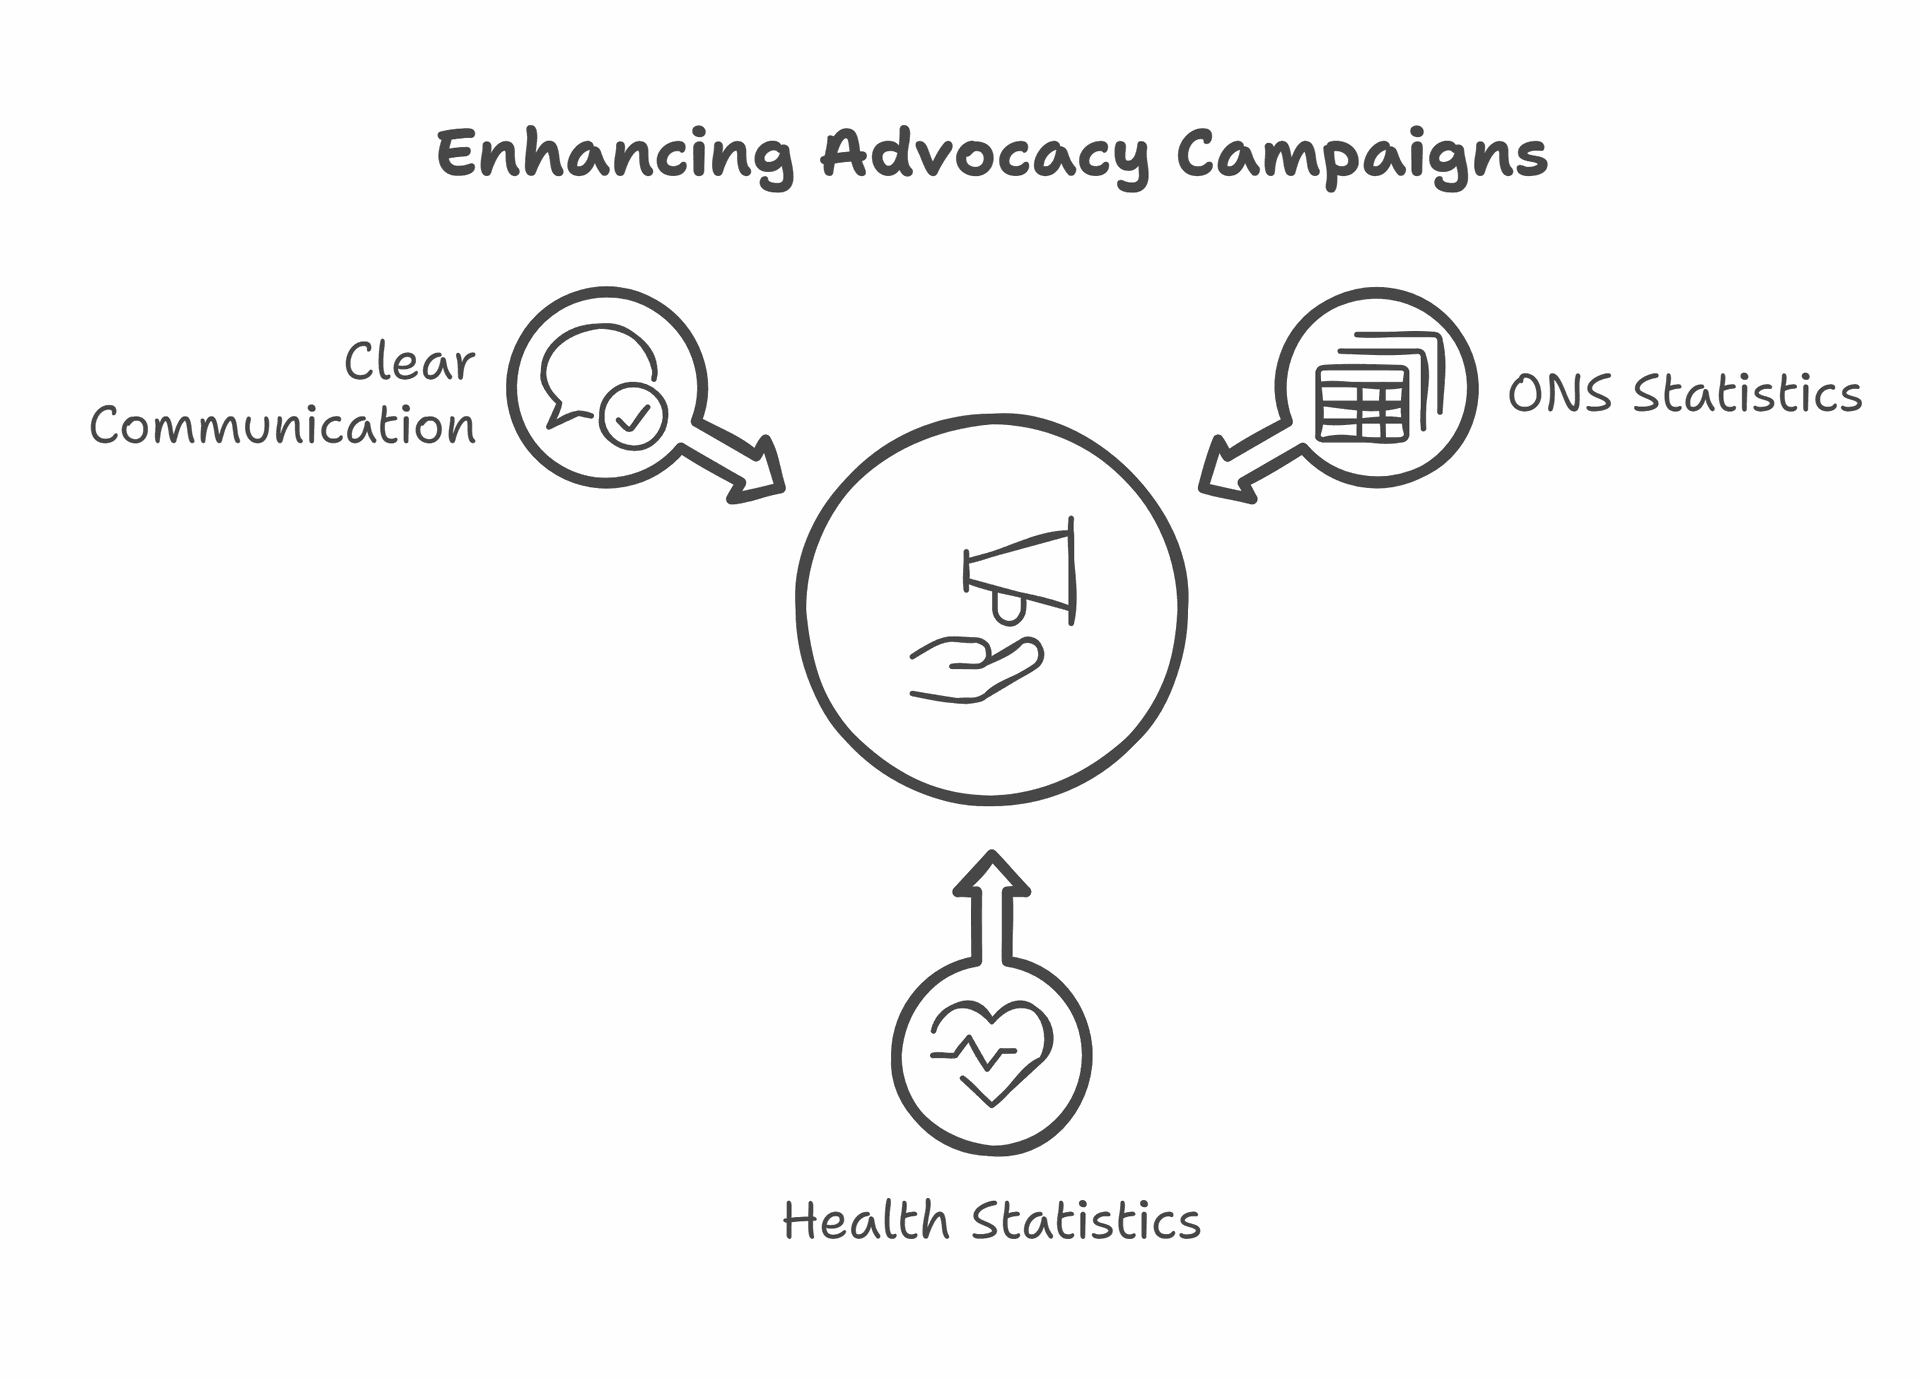
Understanding Advocacy Campaigns
Advocacy campaigns aim to drive social change through strategic communication and public mobilisation. They rely on data to shape messages and influence public opinion.
The Role of Data in Advocacy
Data forms the backbone of effective advocacy campaigns. It provides credibility and helps craft compelling arguments. Statistics and research findings strengthen campaign messages and support policy recommendations.
Advocates use data to identify key issues and target audiences. This information guides strategy development and resource allocation.
Quantitative data, such as survey results or government statistics, offer concrete evidence of problems or trends. Qualitative data, like personal stories, add emotional impact to campaigns.
Regular data analysis allows campaigners to track progress and adjust tactics as needed. This ensures campaigns remain relevant and effective over time.
Key Components of Effective Advocacy
Successful advocacy campaigns share several crucial elements. Clear goals and objectives provide direction and help measure success. A well-defined target audience ensures messages reach those who can effect change.
Strategic communication is vital. Campaigns must craft persuasive messages tailored to their audience. These often combine factual information with emotional appeals.
Building coalitions and partnerships amplifies a campaign's reach and impact. Diverse supporters lend credibility and expand resources.
Advocacy campaigns must be adaptable. They should respond to changing circumstances and new information. This flexibility helps maintain momentum and overcome obstacles.
Accountability is key. Campaigns should track their progress and be transparent about their methods and funding sources. This builds trust with supporters and decision-makers alike.
Leveraging ONS Data for Advocacy
The Office for National Statistics (ONS) provides valuable data for advocacy efforts. ONS statistics offer reliable information to support campaigns and influence policy decisions.
Accessibility of ONS Data
The ONS makes its data easily available to the public. Their website offers a range of statistics on the UK's economy, society and population. This includes figures on housing needs, education, and healthcare.
Advocates can access these statistics free of charge. The ONS also creates simple videos to explain data concepts to wider audiences.
To help people understand complex information, the ONS offers:
- Interactive data visualisations
- Downloadable datasets
- Regular statistical bulletins
These tools allow advocacy groups to find relevant data quickly. They can then use this information to support their campaigns and policy proposals.
Data Analytics and Strategic Planning
ONS data enables evidence-based advocacy strategies. By analysing official statistics, campaigners can identify trends and target their efforts more effectively.
For example, public health advocates might use ONS data on:
- Disease prevalence
- Healthcare access
- Mortality rates
This information helps them raise awareness and influence policy decisions. Data analytics also allows advocates to measure the impact of their campaigns over time.
The ONS offers a service called ONS Local, which provides tailored data for local authorities. This helps advocacy groups address specific community needs in their strategic planning.
Shaping Policy Decisions
ONS statistics play a crucial role in shaping policy decisions. These data-driven insights help policymakers and advocacy groups make informed choices that lead to meaningful change.
Influencing Policy with ONS Statistics
ONS statistics provide a solid foundation for influencing policy decisions. Advocacy groups and policymakers use these data to support their arguments and push for change. The evidence-based approach strengthens policy-making processes and improves outcomes.
Key ways ONS statistics influence policy:
- Identifying trends and issues
- Measuring policy impact
- Forecasting future needs
- Comparing regional differences
ONS data often reveal hidden problems or opportunities that shape policy priorities. For example, employment statistics might highlight areas needing job creation programmes.
Case Studies of Successful Influences
Several campaigns have used ONS statistics to drive policy changes. These examples show how data can lead to real-world improvements.
- Housing Policy Reform: ONS data on homelessness rates and housing affordability led to new affordable housing initiatives.
- Healthcare Resource Allocation: Population health statistics informed decisions on where to build new hospitals and clinics.
- Education Funding: School performance data influenced budget allocations for struggling schools.
The ONS vision for public policy analysis aims to provide even more robust evidence for decision-making. This includes linking administrative data to create a fuller picture of societal issues.
Advocacy in Different Sectors
Advocacy plays a vital role across various sectors, driving change and raising awareness for important causes. Different fields employ unique strategies to achieve their goals and make a lasting impact.
Social Justice and Human Rights
Data-driven advocacy is crucial in social justice and human rights campaigns. Organisations use statistics to highlight inequalities and push for policy changes.
Key areas of focus include:
- Racial equality
- Gender rights
- LGBTQ+ issues
- Economic justice
Advocates leverage ONS data on income disparities, employment rates, and demographic information to support their arguments. They create infographics and reports to make complex data accessible to the public and policymakers.
Social media campaigns often feature personal stories alongside statistics to create emotional impact. This combination of human experiences and hard data can be particularly effective in swaying public opinion.
Environmental Conservation and Climate Action
Environmental advocates rely heavily on scientific data to make their case. They use ONS statistics on emissions, energy usage, and biodiversity to track progress and set goals.
Common advocacy tactics include:
- Public awareness campaigns
- Lobbying for green policies
- Promoting sustainable practices
Connecting advocacy efforts with data helps environmental groups build credibility and influence decision-makers. They often collaborate with scientists to interpret complex climate models and present findings in clear, actionable terms.
Many organisations use interactive online tools to help the public understand their carbon footprint. These tools often incorporate ONS data on household energy consumption and transport usage.
Communicating with Stakeholders
Clear communication is vital when using ONS statistics for advocacy. It helps build trust and ensures key messages reach the right people. Proper engagement and transparency are crucial for success.
Engaging the Public and Key Stakeholders
The Office for National Statistics (ONS) focuses on producing statistics that help people make informed decisions. To engage the public and key stakeholders effectively, advocates should:
• Use simple language to explain complex data
• Create visually appealing infographics and charts
• Share information through social media and newsletters
• Host webinars or workshops to discuss findings
Strategic communication is key to advocacy success. Tailoring messages to different audiences helps ensure maximum impact. For example, policymakers may need detailed reports, while the public might prefer easy-to-understand summaries.
Regularly updating the campaign website with fresh statistics and insights keeps stakeholders engaged. It's also important to monitor public opinion through surveys and feedback to adjust messaging as needed.
Transparency and Reporting
Transparency builds trust and credibility in advocacy campaigns. Advocates should:
• Clearly state data sources and methodologies
• Acknowledge limitations of the statistics used
• Provide regular updates on campaign progress
• Be open about challenges and setbacks
Effective information sharing is crucial for maintaining strong relationships with stakeholders. This can include publishing quarterly reports, sending email updates, or holding briefing sessions.
It's important to report both positive and negative findings honestly. This balanced approach demonstrates integrity and helps maintain long-term support for the campaign.
The ONS uses various methods to communicate with stakeholders, which can serve as a model for advocacy campaigns. These might include press releases, social media posts, and direct stakeholder meetings.
Measuring Impact and Accountability
Measuring the impact of advocacy campaigns using ONS statistics is crucial for demonstrating effectiveness and ensuring accountability. Organisations can track changes in key metrics over time to assess their influence on policy and public opinion.
One approach is to use before-and-after comparisons of relevant ONS data. This helps show how targeted issues have changed since the start of a campaign.
Data analytics tools can process large ONS datasets to identify trends and correlations. These insights allow campaigners to refine their strategies and focus on areas with the greatest potential impact.
For educational advocacy, ONS statistics on exam results, school funding, and teacher retention provide valuable benchmarks. Campaigns can track improvements in these areas to demonstrate their influence on educational outcomes.
Accountability is enhanced by regularly reporting campaign progress using ONS data. This transparency builds trust with supporters and stakeholders.
Some key metrics to consider:
- Changes in relevant legislation or policies
- Shifts in public opinion polls
- Improvements in target socioeconomic indicators
- Media coverage and social media engagement
By consistently measuring impact against ONS benchmarks, advocacy groups can prove their effectiveness and maintain accountability to their supporters and beneficiaries.
Best Practices in Using ONS Statistics for Advocacy
The Office for National Statistics (ONS) produces official statistics that can be valuable for advocacy campaigns. To use these statistics effectively, it's important to follow some key best practices.
Firstly, ensure you understand the context of the data. ONS statistics are designed to be impartial and objective. It's crucial to respect this neutrality when using them for advocacy purposes.
Always cite the ONS as the source of your data. This lends credibility to your campaign and allows others to verify the information.
Be careful not to cherry-pick data. Present a balanced view of the statistics, including any limitations or caveats mentioned by the ONS.
Use visual aids to make the data more accessible. Graphs, charts, and infographics can help convey complex information quickly and clearly.
Keep up to date with the latest ONS releases. Statistics are regularly updated, and using the most recent data strengthens your advocacy efforts.
When interpreting statistics, be cautious about drawing causal relationships. Correlation does not always imply causation.
Lastly, consider the quality of the statistics you're using. The ONS provides information on the reliability and limitations of their data. Understanding these factors helps ensure responsible use of statistics in advocacy work.
Frequently Asked Questions
The Office for National Statistics (ONS) provides valuable data for advocacy campaigns. These statistics can strengthen arguments, track policy impacts, and inform evidence-based strategies.
How can ONS data be used to strengthen advocacy campaigns?
ONS data gives campaigns solid facts to back up their messages. Numbers from a trusted source like the ONS make arguments more convincing.
Advocates can use ONS figures to show the size of an issue. For example, poverty statistics can highlight how many people a new policy could help.
What types of statistics does the ONS provide that are useful for policy advocacy?
The ONS offers a wide range of statistics on social and economic topics. These include figures on employment, health, education, and more.
Population data from the ONS can help campaigners understand who their efforts might affect. Economic statistics can show how policies might impact different groups.
In what ways does ONS ensure the reliability and integrity of its data?
The ONS uses strict methods to collect and check data. They follow rules to make sure their work is impartial and free of political influence.
Regular reviews help keep ONS practices up to date. They also share how they work, so people can trust their numbers.
How can one effectively interpret ONS statistics for use in evidence-based campaigning?
Reading ONS guides can help make sense of their data. It's key to look at the full context of any statistic.
Comparing figures over time or between groups can reveal trends. This can show if a problem is getting better or worse.
What resources are available for learning how to use ONS data in advocacy efforts?
The ONS offers videos that explain data and statistics in simple terms. These can help advocates understand and use ONS information.
Their website has guides on how to find and use different types of data. Some groups also offer training on using statistics for campaigns.
Can ONS statistics be used to track policy impact over time, and if so, how?
Yes, ONS data can show how policies affect people over time. Regular surveys track changes in areas like income, health, and work.
To measure impact, look at ONS figures from before and after a policy starts. Changes in these numbers can suggest if the policy is working as planned.