Regional public sector buyer data offers vital insights into government spending patterns across different areas of the UK. This information helps taxpayers, policymakers, and researchers understand how public funds are allocated and used. The UK government publishes detailed data on public sector procurement, which shows significant variations in spending between regions.
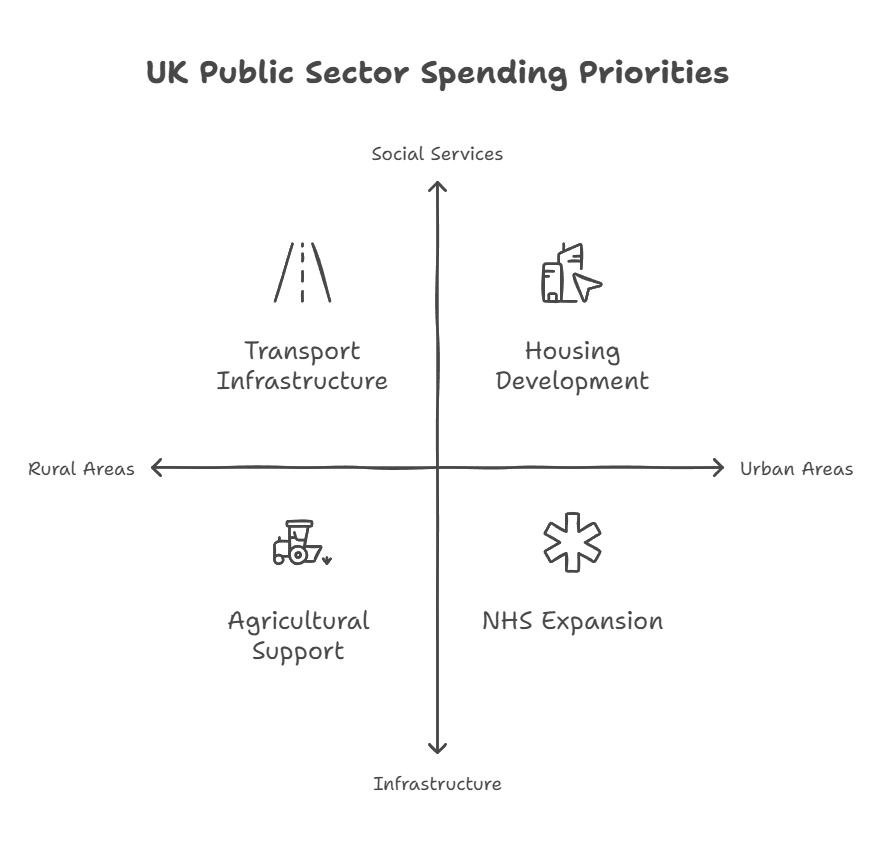
Public sector buyers include local councils, NHS trusts, and central government departments. Each region has unique needs and priorities that shape its spending. For example, rural areas might allocate more funds to transport infrastructure, while urban centres may focus on housing and social services.
UK Research & Innovation and the Ministry of Defence are among the largest public sector buyers nationwide. Their procurement decisions can have a big impact on regional economies. Understanding these patterns can help businesses target their services to public sector needs more effectively.
Key Takeaways
- Regional public sector buyer data reveals spending patterns across the UK
- Public sector IT spending has grown by 41% in recent years
- Data on regional public finances helps improve fiscal management and transparency
Overview of Regional Public Sector Buyer Data
Regional public sector buyer data offers crucial insights into government spending patterns across different areas. This information helps track resource allocation and assess economic impacts at local and national levels.
Concept and Importance
Regional public sector buyer data tracks how government bodies spend money in different parts of the country. It covers purchases made by central government, local government, and other public sector organisations.
This data is vital for several reasons:
- Transparency: It shows how taxpayer money is used.
- Policy-making: It helps shape targeted economic policies.
- Economic analysis: It reveals spending patterns and regional differences.
The Office for National Statistics (ONS) plays a key role in collecting and analysing this information. Their reports provide a detailed look at public sector finances across UK regions.
Legal and Organisational Structure
The legal framework for regional public sector buyer data varies across the UK. In England and Wales, water supply is managed by private companies, while in Scotland and Northern Ireland, it's a public sector function.
Government departments, local councils, and other public bodies all contribute to this data. The Treasury's Country and Regional Analysis (CRA) is a key tool for breaking down spending by region.
Data collection methods are evolving. The ONS is exploring new ways to make public sector spending data more localised and timely. This includes using PAYE RTI data to track public sector wages and salaries more accurately.
Public Sector Revenue
Public sector revenue comes from various sources and is distributed across regions in the UK. The allocation of funds impacts public services and regional development.
Sources of Income
The main sources of public sector revenue in the UK include income tax, value added tax (VAT), and social contributions. These taxes and contributions form the backbone of government income.
Income tax is a major source, with higher rates in some regions due to differences in income levels. VAT is applied uniformly across the UK, but consumption patterns affect regional contributions.
North Sea oil and gas revenue is a significant source for Scotland. In the 2023 financial year, Scotland showed the largest percentage increase in revenue per head at 17.5%, largely due to this income.
Public sector debt interest also impacts overall revenue. The government must balance income against debt repayments.
Allocation and Distribution
Revenue allocation varies across England, Scotland, Wales, and Northern Ireland. Each country and region has different needs and economic conditions that affect distribution.
London and the South East often generate higher revenue due to their economic output. This can lead to debates about fair allocation to other regions.
The UK government uses various methods to determine regional funding. These include:
• Population-based allocation
• Needs-based assessment
• Economic performance indicators
The North East had the largest percentage increase in revenue per head at 12.6% using a population-based method in the 2023 financial year.
Regional differences in public services can result from varying revenue levels and allocation decisions. This impacts areas such as healthcare, education, and infrastructure development.
Expenditure and Public Services
Public spending in the UK varies across regions and sectors. The government allocates funds to different public services based on various factors and needs.
Analysis of Expenditure Per Head
Expenditure per head differs across UK regions. These figures are calculated using mid-year population estimates and total expenditure on services.
London often sees higher spending due to its unique needs as a capital city. Northern Ireland typically has higher expenditure per head compared to other regions.
Health expenditure makes up a large portion of public spending. NHS spending varies by region, reflecting local healthcare demands and infrastructure.
The government uses the Classification of the Functions of Government (COFOG) to categorise expenditure. This system helps track spending across different public service areas.
Government Expenditure by Sector
Public expenditure is spread across various sectors. General public services, including administration and debt interest, form a significant part of government spending.
Health and social care often receive the largest share of the budget. Education and defence are other major spending areas.
Recent years have seen new expenditure categories emerge:
- Energy Profits Levy
- Energy Bills Support Scheme
These measures aim to address energy market challenges and support households.
Public transport and infrastructure investment vary widely between regions. Rural areas often face different spending priorities compared to urban centres.
Government expenditure patterns can shift based on economic conditions and policy priorities. Regular reviews ensure funds are allocated effectively across sectors.
Fiscal Management
Regional public sector finances involve complex fiscal management strategies. These strategies aim to balance revenue and expenditure while adhering to budgetary policies.
Fiscal Balance and Public Debt
The net fiscal balance varies across UK regions. Some areas show a net fiscal surplus, while others face a deficit. London and the South East displayed an increased surplus in the financial year ending 2023.
Scotland's deficit decreased using the geographic method for North Sea oil and gas apportionment. Other regions saw increased deficits.
Public sector finance statistics provide crucial data for analysing these trends. The Office for Budget Responsibility uses this information to forecast future fiscal performance.
Public debt levels often correlate with fiscal balance. Regions with persistent deficits may accumulate higher debt over time.
Budgetary Policies and Adjustments
Budgetary policies shape regional fiscal management. The Department for Energy Security and Net Zero influences energy-related expenditure.
Recent initiatives include the Energy Bills Relief Scheme and Energy Price Guarantee. These programmes affect regional budgets and fiscal balances.
Expenditure increases in certain sectors may require budgetary adjustments. Devolved Administrations play a key role in managing their respective regional finances.
The UK government revises Corporation Tax apportionment methods periodically. This impacts regional revenue calculations from 2016 onwards.
Fiscal management strategies must adapt to changing economic conditions. Regular reviews and adjustments help maintain financial stability across UK regions.
Statistical Methods and Quality
Regional public sector buyer data relies on robust statistical practices and transparency. The methods used ensure accurate insights into government spending across different areas.
Data Collection and Analysis
Data collection for regional public sector buyer information involves gathering financial records from various government bodies. This includes local councils, public agencies, and central government departments.
Analysts use specialised software to process large datasets. They clean the data to remove errors and inconsistencies.
Statistical techniques help identify patterns and trends in public sector spending. These may include:
• Time series analysis
• Regression models
• Cluster analysis
The results provide valuable insights into regional variations in government procurement and expenditure.
Standards of Accuracy and Transparency
The Quality and Methodology Information (QMI) report outlines the standards for regional public sector finance data. It details the strengths and limitations of the statistics.
Adherence to the Code of Practice for Statistics ensures high-quality outputs. This promotes trust in the data among users and stakeholders.
Regular audits and peer reviews help maintain accuracy. They also identify areas for improvement in data collection and analysis methods.
Transparency is key. Detailed methodologies and data sources are published alongside the statistics. This allows users to understand how the figures were produced.
Economic Indicators and Trends
Economic indicators provide crucial insights into regional public sector spending patterns and trends. They help analyse budgets and expenditures in context of broader economic conditions.
Inflation Adjustments and Real Terms Analysis
When examining regional public sector buyer data, it's essential to consider inflation adjustments. Nominal terms reflect raw spending figures, while real terms account for inflation's impact. GDP deflators are used to convert nominal values to real terms, allowing for more accurate comparisons over time.
Real terms analysis reveals true spending power changes. For example, a 2% budget increase may seem positive, but if inflation is 3%, there's a net decrease in purchasing power. This approach is vital for assessing long-term trends in public sector procurement and spending efficiency.
Employment and Earning Statistics
Employment rates and average earnings are key indicators for regional public sector analysis. They influence tax revenues and demand for public services.
Higher employment rates typically boost local economies, potentially reducing the need for certain public sector interventions. Average earnings data helps gauge regional economic health and can inform public sector wage decisions.
Social protection spending often correlates with employment trends. Regions with lower employment rates may require more resources for welfare programmes. Understanding these relationships is crucial for effective public sector resource allocation and procurement strategies.
Emergency Measures and Unforeseen Challenges
The coronavirus pandemic forced public sector buyers to adapt quickly. Governments rolled out financial support schemes and adjusted procurement practices to address urgent needs.
Coping with the Pandemic's Impact
Public sector buyers faced immense pressure during the COVID-19 crisis. They had to acquire emergency goods like personal protective equipment and ventilators rapidly. Normal procurement rules were often relaxed to speed up purchases.
The UK government launched several support programmes:
- Coronavirus Job Retention Scheme
- Self-Employment Income Support Scheme
- Bounce Back Loan Scheme
- Coronavirus Business Interruption Loan Scheme
These aimed to help businesses and workers stay afloat. Public buyers had to implement these schemes quickly whilst ensuring proper use of funds.
Emergency procurement brought new risks. There were concerns about fraud and misuse of taxpayer money. Buyers needed robust systems to track spending and verify suppliers.
Digital tools became crucial. E-procurement platforms helped manage the surge in purchases. Data analysis was key to spotting issues and improving processes.
Supplementary Resources
Regional public sector buyer data can be enhanced with additional tools and information. These resources provide visual representations and detailed listings to support analysis and decision-making.
Comparative Indexes and Maps
Maps and indexes help compare spending across regions. The Nomenclature of Territorial Units for Statistics (NUTS) and International Territorial Level (ITL) systems divide the UK into areas for statistical purposes. These classifications allow for consistent comparisons of public sector finances.
Index values show relative spending levels between regions. For example, an index might reveal NHS spending is higher in Scotland than in Wales. Such data can be plotted on maps to visualise regional differences at a glance.
Lists of Suppliers and Contracts
Detailed lists of suppliers and contracts offer insight into public sector procurement. Tussell, a data provider, compiles information on government contracts and suppliers.
These lists typically include:
- Supplier names
- Contract values
- Contract durations
- Types of goods or services provided
Such data allows analysis of spending patterns by health function or other categories. It can reveal which suppliers receive the most public funds and in which regions.
Frequently Asked Questions
Public sector finances involve complex calculations and terminology. These questions address key concepts related to debt, borrowing, revenue, deficit, records and fiscal balance.
What constitutes public sector net debt?
Public sector net debt includes financial liabilities minus liquid assets. It covers central government, local authorities and public corporations. The measure excludes public sector banks.
How is public sector borrowing calculated?
Public sector borrowing is the difference between total revenue and total spending. It includes both current and capital expenditures. The figure is calculated monthly and annually.
What are the components of public sector revenue?
Public sector revenue comes from taxes, national insurance contributions and other sources. Major components include income tax, VAT and corporation tax. Non-tax revenue includes interest and dividends.
What does public sector deficit convey?
The public sector deficit shows how much the government's spending exceeds its income. A larger deficit indicates more borrowing is needed. It's a key measure of fiscal health.
How can one access Public Finance records?
Public finance records are available through government websites and publications. The Office for National Statistics provides detailed data. Some records may require special access permissions.
What is meant by net fiscal balance?
Net fiscal balance is the difference between total public sector revenue and total public sector expenditure. It shows whether a region is a net contributor or beneficiary of public finances.